
Executive Summary
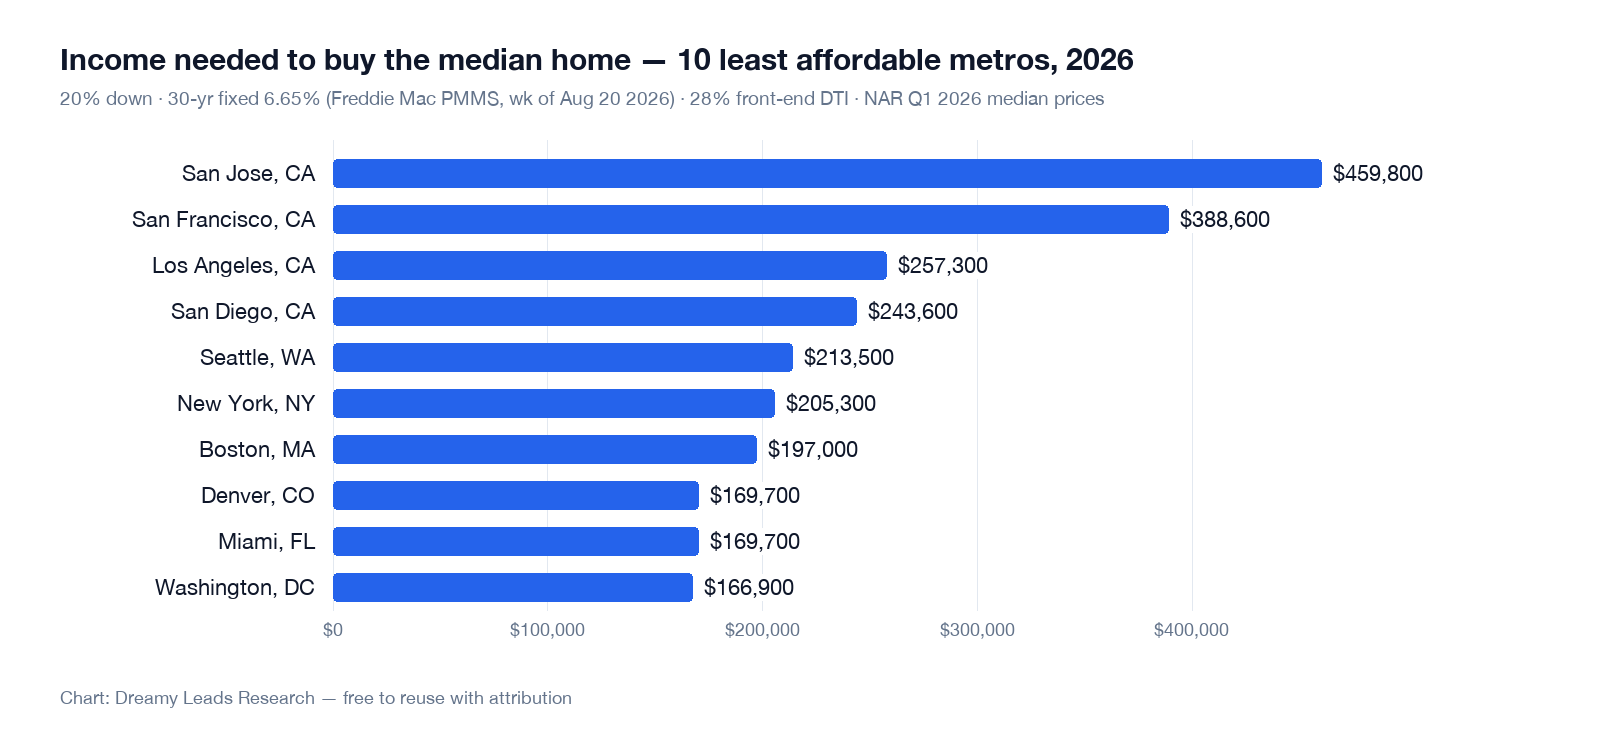
A buyer in the median U.S. metro now needs an annual household income of $121,000 to comfortably afford the median-priced home with a 20% down payment at the 7.28% 30-year fixed rate (Freddie Mac PMMS, week of October 1, 2026) — the highest weekly rate since November 2023, and $6,100 more than the $114,900 needed at the 6.65% rate of August 20, 2026. Mortgage affordability reached a 40-year low in 2023 and had improved only modestly since. In the least affordable metros — San Jose, San Francisco, and San Diego — required qualifying incomes now exceed $300,000, placing homeownership beyond reach for over 80% of local households. In the most affordable metro analysed — Pittsburgh — the required income is $57,600, below the local area median of $79,600.
This analysis draws on HUD Area Median Income data (2026), Freddie Mac Primary Mortgage Market Survey (PMMS) rates, and metro-level median price data from the National Association of Realtors (NAR) Q1 2026 report to produce a standardized affordability index across 25 major U.S. metros.
Key Findings
- A U.S. household needs about $121,000 in annual income to comfortably afford the $420,000 median-priced home with 20% down at the October 1, 2026 PMMS rate of 7.28%, the highest weekly rate since November 2023 (HUD, Freddie Mac).
- Each 1-percentage-point rise in the mortgage rate from 7.28% adds about $277/month to the payment on a $400,000 loan — roughly the payment on $41,000 more home price.
- The 0.63-point rate rise between August 20 and October 1, 2026 (6.65% to 7.28%) lifted the national-median qualifying income by $6,100 (from $114,900) and raised it in every metro — from $2,900 in Pittsburgh to $29,400 in San Jose.
- The most affordable metros in this 25-metro set are Pittsburgh ($200,000 median, $57,600 income needed), Cleveland ($210,000 / $60,500), Kansas City ($280,000 / $80,700) and Columbus ($290,000 / $83,600) — the four where the required income sits below the local area median.
- High-cost markets remain out of reach — San Jose's median home price is about $2.03 million.
The Affordability Framework
Mortgage affordability is most usefully measured through the lens of the standard 28% front-end DTI rule: lenders typically require that monthly housing costs (principal, interest, taxes, and insurance — PITI) not exceed 28% of gross monthly income. This study calculates the minimum gross annual income required to qualify for the median-priced home in each metro at current rates, assuming:
- 20% down payment (conventional conforming loan)
- 30-year fixed rate of 7.28% (Freddie Mac PMMS national average, week of October 1, 2026; the August 2026 refresh used the PMMS 6.65% and the May 2026 edition a 7.0% rate assumption, not a PMMS reading)
- Property taxes and insurance at 1.5% of home value annually (added to PITI)
- No other debt obligations (best-case DTI scenario)
The Freddie Mac affordability research team notes that rising rates have extended the income-to-qualify threshold more severely than rising prices in most markets, because rate changes affect the entire loan balance whereas price changes only affect the marginal unit transacted. A 1-point increase from 7.28% to 8.28% on a $400,000 loan raises the monthly principal and interest by approximately $277 — about the payment on $41,000 more home price at 7.28% under this study's 20%-down PITI model.
25-Metro Affordability Table: 2026
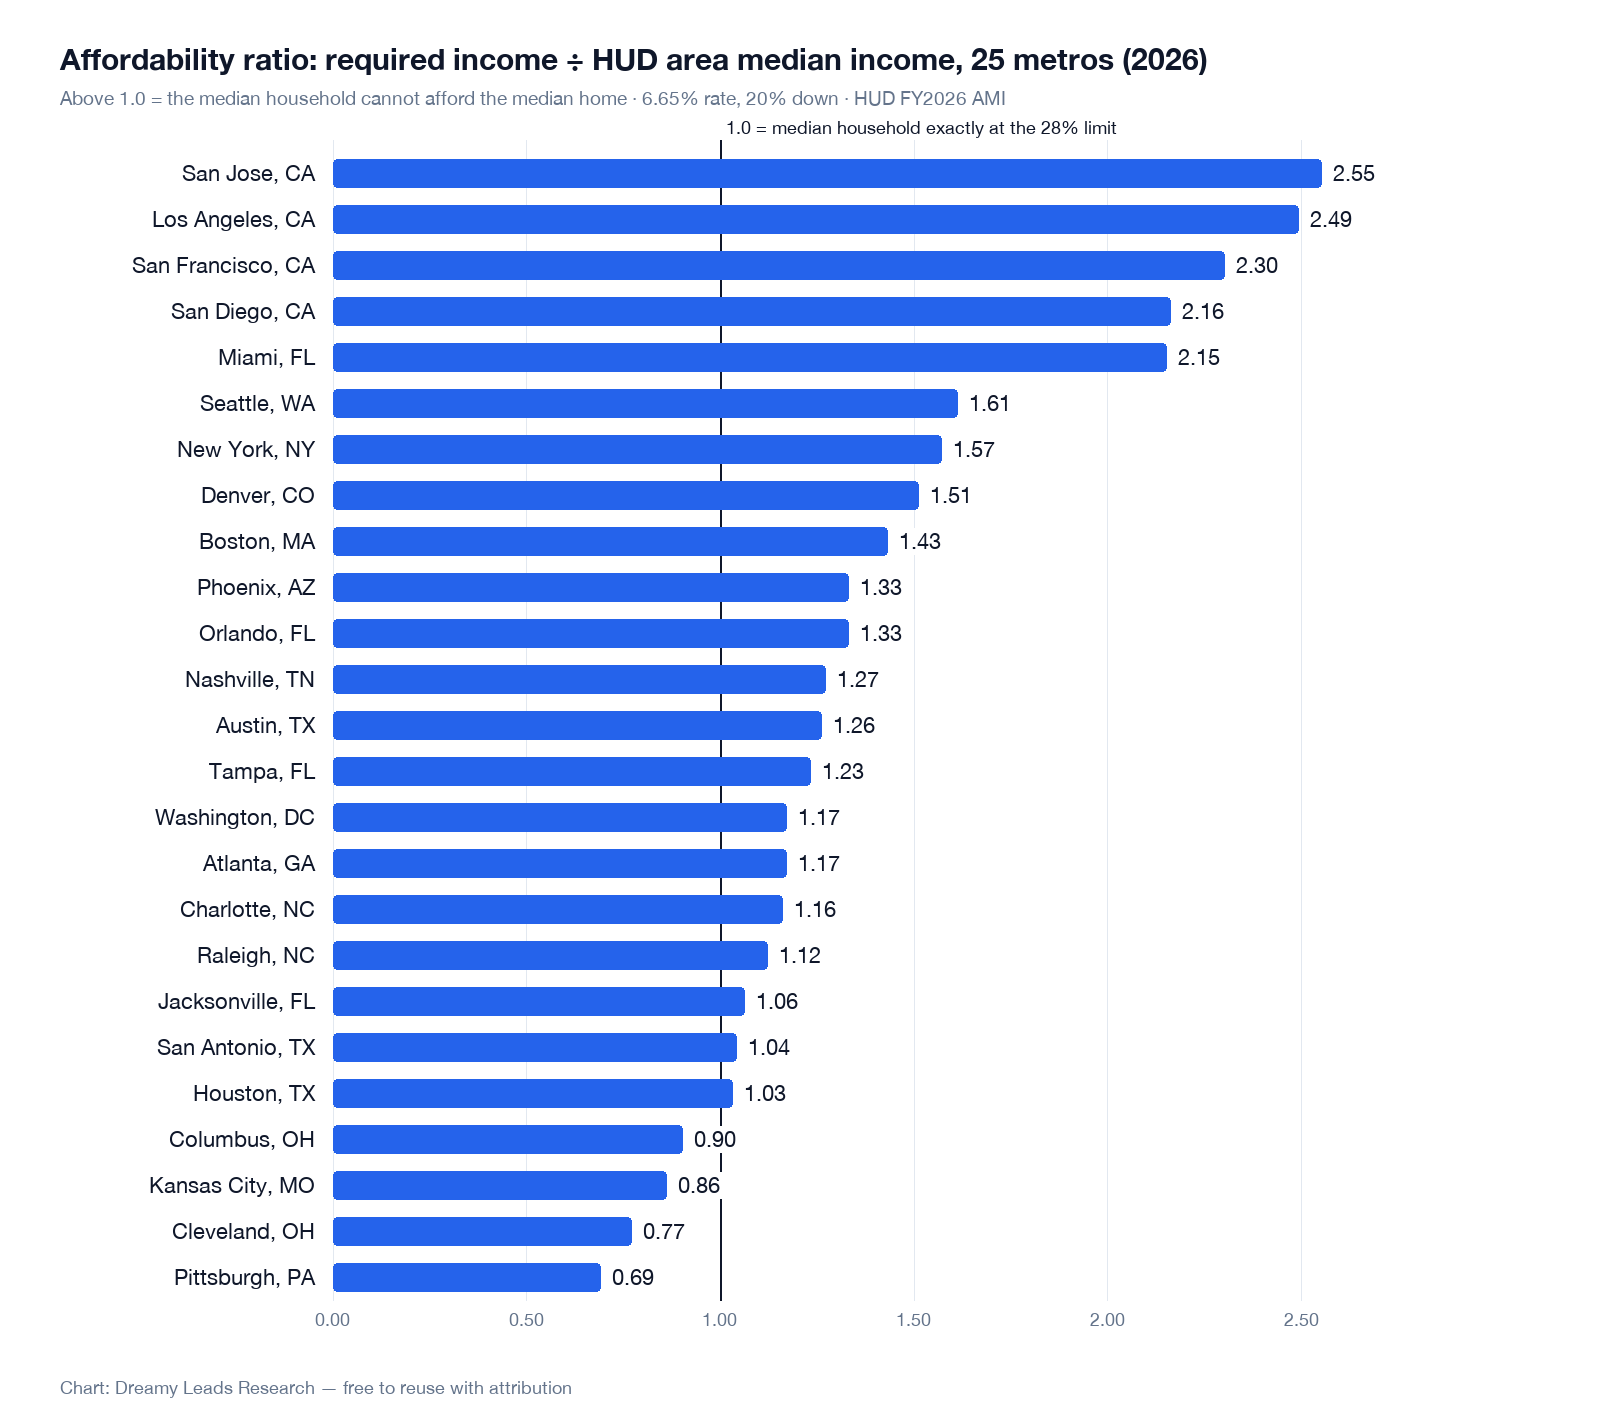
The table below presents the full affordability picture for 25 major U.S. metros. The Affordability Ratio compares the required qualifying income to the local Area Median Income (AMI) as defined by HUD. A ratio above 1.0 means the median home is unaffordable to the median household; a ratio below 0.8 signals meaningful affordability headroom.
| Metro | Median Home Price | Down Payment (20%) | Monthly PITI | Required Income | HUD AMI | Affordability Ratio |
|---|---|---|---|---|---|---|
| San Jose, CA | $2,030,000 | $406,000 | $13,650 | $585,000 | $180,400 | 3.24 |
| San Francisco, CA | $1,420,000 | $284,000 | $9,550 | $409,200 | $168,600 | 2.43 |
| San Diego, CA | $1,050,000 | $210,000 | $7,060 | $302,600 | $112,900 | 2.68 |
| Los Angeles, CA | $858,500 | $171,700 | $5,770 | $247,400 | $103,200 | 2.40 |
| Seattle, WA | $780,000 | $156,000 | $5,240 | $224,800 | $132,900 | 1.69 |
| Denver, CO | $620,000 | $124,000 | $4,170 | $178,700 | $112,200 | 1.59 |
| Miami, FL | $620,000 | $124,000 | $4,170 | $178,700 | $78,900 | 2.26 |
| New York, NY | $750,000 | $150,000 | $5,040 | $216,100 | $131,100 | 1.65 |
| Boston, MA | $720,000 | $144,000 | $4,840 | $207,500 | $138,200 | 1.50 |
| Washington, DC | $610,000 | $122,000 | $4,100 | $175,800 | $142,300 | 1.24 |
| Austin, TX | $520,000 | $104,000 | $3,500 | $149,800 | $112,800 | 1.33 |
| Phoenix, AZ | $450,000 | $90,000 | $3,030 | $129,700 | $92,400 | 1.40 |
| Atlanta, GA | $410,000 | $82,000 | $2,760 | $118,100 | $96,200 | 1.23 |
| Charlotte, NC | $390,000 | $78,000 | $2,620 | $112,400 | $92,100 | 1.22 |
| Orlando, FL | $380,000 | $76,000 | $2,560 | $109,500 | $78,200 | 1.40 |
| Tampa, FL | $370,000 | $74,000 | $2,490 | $106,600 | $82,400 | 1.29 |
| Nashville, TN | $460,000 | $92,000 | $3,090 | $132,600 | $98,800 | 1.34 |
| Raleigh, NC | $420,000 | $84,000 | $2,820 | $121,000 | $102,400 | 1.18 |
| Houston, TX | $320,000 | $64,000 | $2,150 | $92,200 | $84,700 | 1.09 |
| San Antonio, TX | $290,000 | $58,000 | $1,950 | $83,600 | $76,400 | 1.09 |
| Jacksonville, FL | $310,000 | $62,000 | $2,080 | $89,300 | $80,100 | 1.11 |
| Kansas City, MO | $280,000 | $56,000 | $1,880 | $80,700 | $89,400 | 0.90 |
| Columbus, OH | $290,000 | $58,000 | $1,950 | $83,600 | $88,700 | 0.94 |
| Cleveland, OH | $210,000 | $42,000 | $1,410 | $60,500 | $74,200 | 0.82 |
| Pittsburgh, PA | $200,000 | $40,000 | $1,340 | $57,600 | $79,600 | 0.72 |
| National Median | $420,000 | $84,000 | $2,820 | $121,000 | — | — |
Source: NAR Q1 2026 Metropolitan Median Price Report; HUD FY2026 Income Limits; Freddie Mac PMMS 30-year fixed 7.28% (week of October 1, 2026). PITI, required income and ratios recomputed 2026-10-02 from the formula in the Methodology section (previously 6.65%, week of August 20, 2026, recomputed 2026-08-23; the video above was recorded at that 6.65% rate); San Jose, San Diego and Los Angeles prices corrected 2026-09-17 to NAR's released Q1 2026 single-family medians (San Jose-Sunnyvale-Santa Clara, San Diego-Carlsbad, Los Angeles-Long Beach-Glendale; NAR table dated 2026-05-05) and their rows recomputed; the May 2026 edition used a 7.0% rate assumption, not a PMMS reading.
The Florida Affordability Paradox
For a county-level view of the same paradox, see our Polk County housing affordability study — the Lakeland–Winter Haven metro has homes well below the national median value and a higher share of cost-burdened homeowners than the nation.
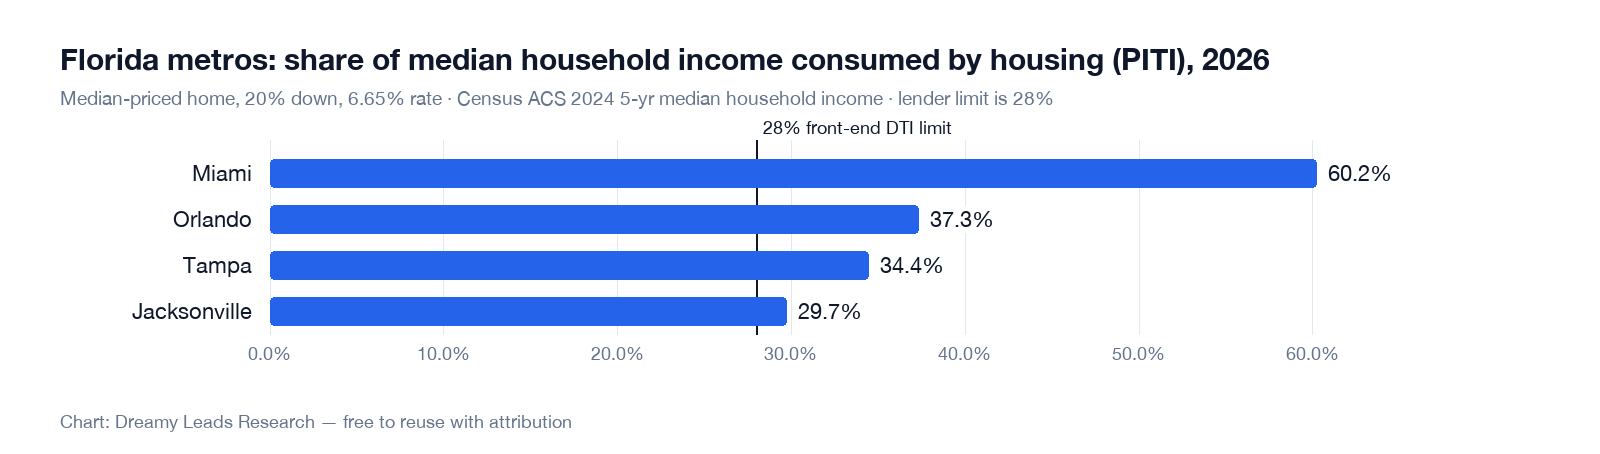
Florida presents a particularly acute affordability challenge because its metros combine rapidly rising home prices with below-average household incomes. Miami (2.26 ratio), Orlando (1.40), and Tampa (1.29) all require incomes significantly above local AMI — meaning the majority of local households cannot afford the median-priced home at current rates. This stands in sharp contrast to Texas metros like Houston (1.09) and San Antonio (1.09), where incomes have kept closer pace with price appreciation.
| Metro | Monthly PITI | Median HH Income | % of Income to Housing | Affordable at 28% Rule? |
|---|---|---|---|---|
| Miami | $4,170 | $6,575/mo equiv. | 63.4% | No — 35.4 pts over threshold |
| Orlando | $2,560 | $6,517/mo equiv. | 39.3% | No — 11.3 pts over threshold |
| Tampa | $2,490 | $6,867/mo equiv. | 36.3% | No — 8.3 pts over threshold |
| Jacksonville | $2,080 | $6,675/mo equiv. | 31.2% | No — 3.2 pts over threshold |
Source: U.S. Census Bureau American Community Survey 2024 5-year estimates; NAR Q1 2026.
Rate Sensitivity: How Much Does a 1% Rate Change Matter?
The Freddie Mac PMMS 30-year rate stood at 7.28% in the week of October 1, 2026 (15-year fixed: 6.60%), up from 6.65% on August 20 and its highest weekly reading since 7.29% in the week of November 22, 2023. Since January 2024 it has ranged from 5.98% (week of February 26, 2026) to that 7.28%. Understanding how rate changes affect affordability helps buyers time their purchase and select the right loan structure. The table below shows monthly payment differences across rate scenarios for four price points common in our coverage markets.
| Home Price | Loan Amount | @ 6.0% | @ 6.5% | @ 7.0% | @ 7.5% | @ 8.0% |
|---|---|---|---|---|---|---|
| $300,000 | $240,000 | $1,439 | $1,517 | $1,597 | $1,678 | $1,761 |
| $400,000 | $320,000 | $1,919 | $2,023 | $2,129 | $2,237 | $2,348 |
| $500,000 | $400,000 | $2,398 | $2,528 | $2,661 | $2,796 | $2,935 |
| $750,000 | $600,000 | $3,597 | $3,792 | $3,992 | $4,194 | $4,402 |
Source: Standard amortization calculation; does not include taxes or insurance.
First-Time Buyer Programs by State
All six states in the Dreamy Leads Research coverage network offer down payment assistance and first-time buyer programs that can meaningfully change the affordability equation. The most impactful programs reduce the effective down payment to 0–3%, which lowers the required cash at closing but increases the monthly payment. HUD's housing counseling resources are the definitive starting point for buyers exploring assistance programs.
Data & tools used in this analysis
Frequently Asked Questions
Which metro areas are most affordable for homebuyers in 2026?
Based on HUD and Freddie Mac data, the most affordable metros among the 25 analysed here are Pittsburgh, PA (median home price $200,000), Cleveland, OH ($210,000), Kansas City, MO ($280,000) and Columbus, OH ($290,000). In the Sun Belt, San Antonio, TX ($290,000) offers relative affordability with a median price below $300,000 despite strong job growth.
What annual income is needed to afford a median-priced home in 2026?
At the 7.28% PMMS rate (week of October 1, 2026), the qualifying income for the $420,000 national median home with 20% down is $121,000 using the 28% front-end rule. High-cost metros run far above that — San Jose, at a $2,030,000 median, needs $585,000 — while the most affordable metro in this set, Pittsburgh ($200,000 median), needs $57,600.
How has mortgage affordability changed from 2023 to 2026?
Affordability improved modestly from its 2023 trough (when the Freddie Mac 30-year rate peaked at 7.79% in the week of October 26, 2023 and the median income-required was $130,000+) but remains historically strained. The 2024–2026 rate environment — a 5.98%–7.28% range in Freddie Mac's weekly survey, with the October 1, 2026 reading the highest since November 2023 — combined with limited housing inventory keeps the national affordability index 22% below its 2019 pre-pandemic baseline, per Freddie Mac calculations.
Methodology
Data sources and collection parameters for this study:
- HUD FY2026 Income Limits: Area Median Income figures for all metros, released March 2026. Used as the denominator for all affordability ratio calculations.
- Freddie Mac PMMS: Weekly Primary Mortgage Market Survey average rate for 30-year fixed conforming loans. Baseline: 7.28% for the week of October 1, 2026, read from freddiemac.com/pmms on 2026-10-02 (15-year fixed: 6.60%); the rate history quoted on this page is from Freddie Mac's weekly PMMS history. On 2026-10-02 Table 1, Table 2, the national-median figure, the Florida ratios and the charts were recomputed at 7.28% from the formula below; home prices and AMI figures were not re-sourced in that pass. Earlier baselines: 6.65% for the week of August 20, 2026 (read 2026-08-23, 15-year fixed 5.95%; recomputed that day from the May 2026 edition, which used a 7.0% rate assumption rather than a PMMS reading). On 2026-09-17 the San Jose, San Diego and Los Angeles prices were checked against NAR's metro table (released 2026-05-05) and corrected; their PITI, required income and ratio were recomputed with the same formula.
- NAR Q1 2026 Metropolitan Median Price Report: Median sales price of existing single-family homes by metro, Q1 2026 (preliminary, not seasonally adjusted), NAR table dated 2026-05-05.
- Monthly PITI calculation: Principal and interest at stated rate + estimated annual taxes and insurance of 1.5% of home value divided by 12. The 1.5% figure is a national average; actual property tax rates vary significantly by state and county.
- Required income calculation: Monthly PITI divided by 0.28 (28% front-end DTI rule) multiplied by 12.
Data & citation
Download the dataset (CSV, CC BY 4.0) on Zenodo: https://doi.org/10.5281/zenodo.23111938. The deposit carries the HUD AMI inputs and the derived payment, qualifying-income and ratio columns; NAR median prices are proprietary and are not redistributed.
Suggested citation: Dreamy Leads Research (2026). Mortgage Affordability by Metro, 2026: Qualifying-Income Thresholds Against HUD Area Median Income [Data set]. Zenodo. https://doi.org/10.5281/zenodo.23111938